Help
- Keyboard shortcuts
- Site map
- Design and Accessibility rules
- Partner schools and organizations
- Weblinks that deal with Website Design and Checking
- About the Author of this Website
The following keyboard shortcuts can be used on this Website. Access key is a figure from 0 to 9.
These keyboard shortcuts can be used via a combination of keyboard keys. The list of these combinations sorted by Operating System then by Browser is as follows.
Warning : Shift is sometimes useless on some keyboards (including the QWERTY and QWERTZ keyboards).
- Windows :
- Chrome / Edge / Firefox / K-Meleon / Netscape / Opera 15 : Alt + Shift + Access key
- Internet Explorer : Alt + Shift + Access key then Enter
- Konqueror : Ctrl + Shift + Access key
- Opera 12 : Esc + Shift + Access key
- Macintosh :
- Chrome / Firefox 14+ / Safari 4 : Alt (or Option) + Ctrl + Shift + Access key
- Firefox 14 / Konqueror / Netscape / Safari 3 : Ctrl + Shift + Access key
- Internet Explorer : Ctrl + Shift + Access key then Enter
- Opera 12 : Esc + Shift + Access key
- Opera 15 : Alt (or Option) + Shift + Access key
- Linux :
- Chrome / Edge / Firefox / Galeon/ Internet Explorer / Opera 15 : Alt + Shift + Access key
- Konqueror : Ctrl + Shift + Access key
- Opera 12 : Esc + Shift + Access key
Sources :
Wikipedia, Access key.
Mozilla, Accesskey.
This Web site contains 75 html pages (*.htm files).
The pages translated in English are indicated in parentheses.
- index (indexa) Accueil/Contact (Home/Contact)
- billard (billarda) Billard (Billiards)
- bil_int (bil_inta) Théorie du jeu (Theory of the Game)
- bil_pra (bil_praa) La pratique du billard (The Art of Billiards Play)
- bil_liv (bil_liva) Bibliographie (Bibliography)
- Arte C'est du billard, reportage ARTE
- belier (beliera) Bélier hydraulique (Hydraulic ram)
- Baillenx Pages de Hervé de Baillenx
- bel_pri Principe de fonctionnement
- bel_the Théorie
- bel_pra Pratique
- bel_ann Annexe
- bel_not Notations
- bel_glo Glossaire
- bel_liv (bel_liva) Bibliographie (Bibliography)
- bel_som (bel_soma) Sommaire général (Overall Table of contents)
- snh (snha) Système Nerveux Humain (Human Nervous System)
- snh_int Introduction
- snh_pia Piaget
- snh_des Description fonctionnelle
- snh_glo Glossaire
- snh_liv (snh_liva) Bibliographie (Bibliography)
- snh_som (snh_soma) Sommaire général (Overall Table of contents)
- rel (rela) Relativité (Relativity)
- bot Botanique
- botla Liste des plantes ligneuses dont le nom commun commence par la lettre A
- botlb Liste des plantes ligneuses dont le nom commun commence par la lettre B
- botlc Liste des plantes ligneuses dont le nom commun commence par la lettre C
- botld Liste des plantes ligneuses dont le nom commun commence par la lettre D, E ou F
- botlg Liste des plantes ligneuses dont le nom commun commence par la lettre G
- botlh Liste des plantes ligneuses dont le nom commun commence par la lettre H, I, J, K ou L
- botlm Liste des plantes ligneuses dont le nom commun commence par la lettre M, N ou O
- botlp Liste des plantes ligneuses dont le nom commun commence par la lettre P
- botlq Liste des plantes ligneuses dont le nom commun commence par la lettre Q, R ou S
- botlt Liste des plantes ligneuses dont le nom commun commence par la lettre T, U, V, W, X, Y ou Z
- mus Musique
- orn Ornithologie
- ornla Catalogue des oiseaux d'Europe dont le nom commun commence par la lettre A
- ornlb Catalogue des oiseaux d'Europe dont le nom commun commence par la lettre B
- ornlc Catalogue des oiseaux d'Europe dont le nom commun commence par la lettre C
- ornld Catalogue des oiseaux d'Europe dont le nom commun commence par la lettre D, E ou F
- ornlg Catalogue des oiseaux d'Europe dont le nom commun commence par la lettre G
- ornlh Catalogue des oiseaux d'Europe dont le nom commun commence par la lettre H, I, J, K ou L
- ornlm Catalogue des oiseaux d'Europe dont le nom commun commence par la lettre M, N ou O
- ornlp Catalogue des oiseaux d'Europe dont le nom commun commence par la lettre P
- ornlq Catalogue des oiseaux d'Europe dont le nom commun commence par la lettre Q, R ou S
- ornlt Catalogue des oiseaux d'Europe dont le nom commun commence par la lettre T, U, V, W, X, Y ou Z
- met Météorologie
- liens (liensa) Aide (Help)
- liens1 (liens1a) Art et culture (Art and culture)
- liens2 (liens2a) Jeux (Games)
- liens3 (liens3a) Sciences de la nature (Natural sciences)
- liens4 (liens4a) Sciences appliquées et technologies (Applied sciences and technologies)
- liens5 (liens5a) Sciences humaines et médicales (Human and medical sciences)
- liens6 (liens6a) Société (Society)
- alertea (Warning)
At the time of last update of this page (see bottom of this page), all Web pages of this site have the following properties :
- they comply with W3C normes (HTML and CSS) ;
- they comply with Web Content Accessibility Guidelines (WCAG) 2.0 with Level AA conformance.
The design and accessibility rules of this site are as follows :
- Web design
- Structuration du site en pages : selon une arborescence hiérarchique limitée à une profondeur de trois (règle des "trois clics").
- Version bilingue : version français/anglais de (presque) chaque page.
- Homogénéité des pages : même présentation et mêmes couleurs.
- Liens entre pages du site : depuis chaque page, accès a minima aux pages "Accueil/Contact", "Aide", ainsi qu'aux pages de type père, oncles, frères et fils.
- Page d'accueil : présentation simple, sur un seul écran, avec moteur de recherche interne.
- Web ergonomy (presentation and browsing)
- Page : présentation structurée verticalement selon Barre de menu puis Contenu puis Pied de page, et tenant horizontalement dans l'écran.
- Barre de menu : avec bouton "English/Français" de type bascule.
- Contenu d'une page : structuration linéaire selon titre (rappel de la page père), chapitre (nom de la page courante), sommaire local (uniquement si page longue), paragraphe, sous-paragraphe, sous-sous-paragraphe...
- Pied de page : avec mention du copyright, année de création, nom de l'auteur et date de dernière mise à jour de la page.
- Liens : (presque) tous commençant par une lettre majuscule, et de couleur différente selon le type de lien (non visité, visité, survolé, activé).
- Liens vers fichier téléchargeable : avec indication du type de fichier (.gif, .jpeg, etc.) et de sa taille (en Ko ou Mo).
- Liens extra-page : avec texte court, explicite quant à la page destination.
- Liens intra-page : uniquement dans les pages longues.
- Liens "Précédent/Suivant" : uniquement entre chapitres, entre paragraphes et entre sous-paragraphes.
- Images porteuses d'information : avec texte alternatif (attribut "alt"), court et explicite quant à la fonction et à l'aspect.
- Plan de page : existe.
- Paragraphes : justifiés (à gauche et à droite) et indentés en première ligne.
- Typographie : aucun soulignement, ni texte en majuscule, et avec style "italique" uniquement dans des cas précis.
- Accessibility to sensory handicapped
- Changements de langue : indiqué systématiquement (attribut "lang" dans chaque objet de type tableau, liste, bloc (balise "span"), etc.).
- Objets multimédias (animation, vidéo, son) : ni clignotement, défilement ou mise à jour automatique d'information, ni image animée ou à zone réactive cliquable, ni fenêtre pop-up, ni son, ni listes déroulantes, ni boîtes de dialogue. Les boutons de désactivation des animations et du son sont en effet impossibles à trouver rapidement par un non-voyant.
- Couleurs (utilisation) : rien ne repose uniquement sur la couleur (indication d'une action, sollicitation d'une réponse, distinction d'un élément visuel).
- Couleurs (standardisation) : prises parmi les 16 couleurs de base du standard HTML 4.01 (voir tableau ci-dessous, avec Nom HTML, Nom français et Code hexadécimal selon la notation #RRVVBB).
- Couleurs (contraste) : contraste particulièrement adapté aux daltoniens déficients en vert (soit 80 % des daltoniens, ces derniers représentant 8 % des hommes et 0,5 % des femmes), selon les règles suivantes (voir tableau ci-dessous) :
- Arrière-plan : sans motifs ni texte (donc fond uni) ; couleur "white" pour le fond de page ; couleurs "aqua", "silver" et "white" pour les fonds de menu ; couleurs "yelow" et "red" pour les fonds de lien (respectivement survolé et activé) situés en arrière-plan par rapport au texte de lien.
- Premier plan : couleur "black" pour le texte de page ; couleur "blue" et "purple" pour les textes de lien (respectivement non visité et visité) ; couleur "yellow" et "red" pour les fonds de lien situés en premier plan par rapport au fond de page ou de menu.
- Police de caractères : sans empattements, ni embellissements, ni enluminures (police sans sérif).
- Images : suivies si nécessaire d'un équivalent textuel expliquant le contenu de l'image.
- Titres : balises "h1", "h2", "h3"... logiquement enchaînées et en cohérence avec la présentation des pages en titre, chapitre, paragraphe...
- Tableaux : avec résumé indiquant la fonction menu/données et le nombre de colonnes (attribut "summary"), avec en-têtes de colonnes (attribut "th"), avec si nécessaire correspondance entre cellule et colonne (attributs "id" et "headers").
- Listes : avec numérotation systématique.
- Formules mathématiques : écriture littérale, y compris les fonctions mathématiques (exemple : sin[x]).
- Clefs d'accès des raccourcis clavier : chiffres de 0 à 9 (dont les touches couramment utilisées : 0 Aide ; 1 Accueil).
The following table gives the contrast between each foreground color (in lines) and each background color (in rows) for the 16 basic color from HTML 4.01
This website uses only 24 contrasts indicated by the text "OUI", especially suited to green colorblind deficient.
| Nom HTML | black | navy | blue | green | teal | lime | AQUA | maroon | purple | olive | GRAY | SILVER | RED | fuchsia | YELLOW | WHITE |
| Nom français | noir | bleu foncé | bleu | vert | bleu vert | vert brillant | cyan | marron | violet | vert olive | gris foncé | gris clair | rouge | rose | jaune | blanc |
| Code hexa | 000000 | 000080 | 0000FF | 008000 | 008080 | 00FF00 | 00FFFF | 800000 | 800080 | 808000 | 808080 | C0C0C0 | FF0000 | FF00FF | FFFF00 | FFFFFF |
| BLACK | non | non | non | non | non | non | OUI01 | non | non | non | OUI02 | OUI03 | non | non | non | OUI04 |
| navy | non | non | non | non | non | non | non | non | non | non | non | non | non | non | non | non |
| BLUE | non | non | non | non | non | non | OUI05 | non | non | non | OUI06 | OUI07 | OUI08 | non | OUI09 | OUI10 |
| green | non | non | non | non | non | non | non | non | non | non | non | non | non | non | non | non |
| teal | non | non | non | non | non | non | non | non | non | non | non | non | non | non | non | non |
| lime | non | non | non | non | non | non | non | non | non | non | non | non | non | non | non | non |
| aqua | non | non | non | non | non | non | non | non | non | non | non | non | non | non | non | non |
| maroon | non | non | non | non | non | non | non | non | non | non | non | non | non | non | non | non |
| PURPLE | non | non | non | non | non | non | OUI11 | non | non | non | OUI12 | OUI13 | OUI14 | non | OUI15 | OUI16 |
| olive | non | non | non | non | non | non | non | non | non | non | non | non | non | non | non | non |
| gray | non | non | non | non | non | non | non | non | non | non | non | non | non | non | non | non |
| silver | non | non | non | non | non | non | non | non | non | non | non | non | non | non | non | non |
| RED | non | non | non | non | non | non | OUI17 | non | non | non | OUI18 | OUI19 | non | non | non | OUI20 |
| fuchsia | non | non | non | non | non | non | non | non | non | non | non | non | non | non | non | non |
| YELLOW | non | non | non | non | non | non | OUI21 | non | non | non | OUI22 | OUI23 | non | non | non | OUI24 |
| white | non | non | non | non | non | non | non | non | non | non | non | non | non | non | non | non |
- Html code
- Balises "!DOCTYPE", "html" et "head" : efficaces et en nombre restreint (pour les moteurs de recherche type Google Search).
- Feuille de style (.css, 3 Ko) : feuille externe unique avec attributs de taille redéfinis en relatif ("em" ou pourcentages) plutôt qu'en absolu (pixels).
- Balise "body" : avec attribut "bgcolor" en doublon de la feuille de style (pour compatibilité avec versions de code html inférieures à 3.2).
- Cadres (ou "frame") : aucun.
- Fenêtres secondaires : aucune.
- Liens javascript : aucun (hormis éventuel cassage du nom de domaine).
- Paragraphes : tous explicites (avec balise "p") afin de pouvoir jouer dessus avec la feuille de style.
- Mathematical symbols : coded in html when the code exists (examples : ≤ ∞ Δ ◊).
- Fichiers : nommage représentatif des deux premiers niveaux de la structure du site, sans blanc, ni caractère accentué (car problème sur serveurs Unix). Majuscules évitées au maximum.
- Temps d'accès aux pages : très court, avec quelques pages "pesant" au plus 100 Ko.
The following schools or organizations used this website :
Caption :
CPGE : Classes Préparatoires aux Grandes Ecoles
PFE : Projet de Fin d'Etude
TIPE : Travaux d'Initiative Personnelle Encadrée
TPE : Travaux Pratiques Encadrés
4.1. About the topic "Billiards physics" :
- Bordeaux, Lycée Michel Montaigne, TIPE : Le billard, Maxime Plottu, CPGE 2ème année, PSI*, 2024.
- Bourg-en-Bresse, Lycée Lalande, TIPE : Le billard, Mickaël Jacques, CPGE 2ème année, PC, 2012.
- Caen, Lycée Victor Hugo, TIPE : Le billard, Wilfried Lerot, CPGE 2ème année, PSI, 2008.
- Dijon, Lycée Carnot, TIPE : Le bowling, Pierre Goguelat, CPGE 2ème année, MP, 2011.
- La Flèche, Lycée Prytanée, TIPE : La physique du billard, Matthieu Dolliou, CPGE 2ème année, MP*, 2014.
- Lille, Lycée Faidherbe, TIPE : Le billard, Vincent Bolle, CPGE 1ère année, MPSI, 2008.
- Lille, Lycée Faidherbe, TIPE : Le billard, Sylvain Capelle, CPGE 2ème année, PC, 2011.
- Lille, Lycée Faidherbe, TIPE : Le billard, Maxime Duprez et Romain George, CPGE 2ème année, PSI, 2014.
- Lyon, ECAM, TIPE : Le billard, Jérémy Crétin et Jérémy Quentin, CPGE 2ème année intégrée, PT, 2012.
- Lyon, Lycée Aux Lazaristes, TIPE : Le billard, Florian Carra, CPGE 2ème année, MP, 2011.
- Nancy, Lycée Henri-Poincaré, TIPE : La physique du billard, Julien Vukasin, CPGE 2ème année, MP, 2011.
- Nantes, Lycée Clémenceau, TIPE : La mécanique du billard, Baptiste Martin, CPGE 2ème année, PSI, 2024.
- Neuilly-sur-Seine, Lycée Pasteur, TIPE : La physique du billard, Swann Bareilhe, CPGE 2ème année, MP, 2012.
- Nice, Lycée Masséna, TIPE : Le billard, Siméon Nenoff, Frédéric Bieber et Adrien Génin, CPGE 2ème année, MP et PC, 2008.
- Paris, Lycée Saint-Louis, TIPE : La dynamique du billard, Laura Sobra, CPGE 2ème année, PC, 2011.
- Perpignan, Lycée Arago, TIPE : Le billard, Baudoin Espieux, CPGE 2ème année, PSI, 2013.
- Reims, Lycée Roosevelt, TIPE : Le billard, Chloé Deflandre, Ellyn Dubecq, CPGE 1ère année, MPSI, 2016.
- Saint-Etienne, Lycée Fauriel, TIPE : La mécanique du billard, Victor Soriano, CPGE 2ème année, MP, 2011.
- Valbonne, Lycée International, TIPE : Le billard, Caroline Boyer, CPGE 2ème année, MP, 2012.
4.2. About the topic "Hydraulic ram" :
- Besançon, Lycée Victor Hugo, TIPE : Le bélier hydraulique, Anthony Doubey, CPGE 2ème année, PSI, 2015.
- Brest, ENSTA ParisTech, Projet de pompe hydraulique autonome basé sur un multiplicateur de pression, Vincent Macaigne, 2014.
- Burundi, Faculté des sciences appliquées, Département de Génie Electromécanique, PFE : Possibilité technique et énergétique du pompage pour l'irrigation d'une région agricole du Nord du Burundi, Claude Nkonji, 2009.
- Clermont-Ferrand, Lycée Blaise Pascal, TIPE : Le bélier hydraulique, Baptiste Durand, CPGE 2ème année, PSI, 2014.
- Cluny, Lycée La Prat's, TIPE : Le bélier hydraulique, Geoffroy de Saint-André, CPGE 2ème année, PT, 2011.
- Grenoble, INP-ENSE3, Maquette transparente de bélier hydraulique (YouTube, 03:19) ; Bélier hydraulique : Maquette transparente (YouTube, 06:43) Cyril Benistand, Matthieu Villevieille, Robin Vallée, Thomas Fayer, Pierre Coutouly et Alexandre Wettstein, Atelier d'ingénierie, 2015.
- Grenoble, INP-ENSE3, Modélisation de bélier hydraulique, Jean-Côme Biscay, Kenza Taoussi, Erwan Tardy, Raphaël D'Oliveira, Laurent Dumas, El Bachir Chakir et Pierre Boucher, Atelier d'ingénierie, 2015.
- Grenoble, INP-ENSE3, Projet de bélier hydraulique en haute montagne ; Alex Croutz et Jérémie Serfass, 2ème année, Filière Hydraulique, Ouvrages et Environnement, Option Génie Hydraulique et Ouvrages, 2016.
- Longwy, IUT Longwy, Université Henri Poincaré Nancy1, Projet tutoré : le bélier hydraulique, Quentin Ducassou, Julien Breemersch, Clément Malliard, 2ème année, GTE, 2009.
- Louvain-La-Neuve (Belgique), Ecole polytechnique, Construction d'un bélier dans une ferme près de Kinshasa en RDC, Manon Kummeler, 2024.
- Lyon, ECAM, TIPE : Le bélier hydraulique, Johanna Ankri, Justine Abou Chacra, CPGE 2ème année intégrée, PT, 2015.
- Lyon, INSA, PFE : HydroRam (.pptx, 2.5 Mo), Quentin Letellier, 2012.
- Lyon, Lycée du Parc, TIPE : Du coup de bélier dévastateur au bélier hydraulique salvateur, Florent Joyet, CPGE 1ère et 2ème années, MPSI et PSI, 2007 & 2008.
- Lyon, Lycée La Martinière-Monplaisir, TIPE : Le bélier hydraulique, Tristan Jardel et Ilham Hamdame, CPGE 1ère année, MPSI, 2008.
- Margency, Lycée Notre-Dame de Bury, TPE : Le bélier hydraulique, Nadir Bouchene, Marie Magana, Victor Gillibert, 1ère S, 2010.
- Montpellier, Ecole d'ingénieur SupAgro, Institut des Régions Chaudes, Le bélier hydraulique : mémoire de fin d'études d'ingénieur en agronomie tropicale spécialisé en gestion sociale de l'eau, Adrien Busson, 2010.
- Nantes, Lycée Clémenceau, TIPE : Le bélier hydraulique, David Rousseleau, Jonathan Coueraud et Jules Douet, CPGE 1ère année, MPSI, 2008.
- Nantes, Lycée Eugène Livet, TIPE : Le bélier hydraulique, Romain Leluc et Gwenhael Darcy, CPGE 1ère et 2ème années, PTSI et PT, 2008 & 2009.
- Nice, Lycée Masséna, TIPE : Le bélier hydraulique, Martin Roux, CPGE 2ème année, PC, 2019.
- Nogent-sur-Oise, Lycée Marie-Curie, Projet : Le bélier hydraulique, Louison Richet, Terminale STI2D, 2013.
- Paris, AgroParisTech, PFE : Le bélier hydraulique (projet de valorisation patrimoniale sur le canal de Gignac), Pauline Poutrain, Maelle Delabre, Félicie Aulanier, Christophe Abraham, Paul-Emile Noirot-Cosson, 3ème année, Ingénierie de l'Environnement, 2012.
- Paris, Institut de France, Panneaux descriptifs du fonctionnement d'un bélier hydraulique, dans le cadre du Printemps de l'Industrie (Pavillon de Manse, mars 2009) et des Journées de la Rose (Abbaye royale de Chaalis et musée Jacquemart-André - Chaalis, juin 2009), J.M. Vasseur, Service culturel et pédagogique.
- Paris, Lycée Claude Bernard, TIPE : Principe du bélier hydraulique, Baptiste Mathae, CPGE 2ème année, PSI, 2015 : Le bélier en action (.jpg, 100 Ko), Constitution (.jpg, 100 Ko).
- Paris, Lycée Jean Baptiste Say, TIPE : Le bélier hydraulique, El Hadj Ndiaye, CPGE 2ème année, PSI*, 2025.
- Paris, Lycée Saint-Louis, TIPE : Le bélier hydraulique, Mickael Roucou, CPGE 2ème année, PSI, 2011.
- Paris, Lycée Stanislas, TIPE : Le bélier hydraulique, Matthieu Ansart, CPGE 2ème année, PC, 2015.
- Pau, Université de Pau et des Pays de l'Adour, Projet : Etude et Conception d'un bélier hydraulique, David Béritault et Luc Champault, Master Ingénierie des Systèmes Industriels (ISI), 2007.
- Rouen, Lycée Corneille, TIPE : Le bélier hydraulique, L. Duflot, CPGE 2ème année, PSI, 2011.
- Tananarive (Madagascar), Université d'Antananarivo, ESPA, Contribution à l'étude et réalisation d'un bélier hydraulique : mémoire de fin d'étude d'ingénieur grade Master 2 en Génie Mécanique et Industriel (.pdf, 2.6 Mo), Jean Harson Rakotonoely, 2019 ( http://biblio.univ-antananarivo.mg/pdfs/rakotonoelyJeanH_ESPA_MAST2_19.pdf ).
A noter que ce mémoire reprend quasi-intégralement le texte et les équations des pages Web du Sujet Internet "Bélier hydraulique", comme suit :
- Chapitre Principe : recopie intégrale des Phases de fonctionnement (sans mention de la source) : pages 10 à 11 du mémoire.
- Chapitre Théorie : recopie quasi-intégrale de tout le chapitre (sans mention de la source) : pages 12 à 38 du mémoire.
- Chapitre Pratique : recopie adaptée des paragraphes "Calcul d'un bélier" et "Bélier prototype à construire soi-même" : pages 42 à 47, et 54 à 55 du mémoire.
- Toulouse, Lycée Déodat de Séverac, TIPE : Le bélier hydraulique, Pauline Vie, Marc Chauchat, Gautier Combelles, CPGE 2ème année, PSI, 2015.
- Tours, Lycée Descartes, TIPE : Le bélier hydraulique, Baptiste Gauthier, CPGE 2ème année, PSI, 2025.
- Valbonne, Lycée International, TIPE : Le bélier hydraulique, Raphael Chattot, CPGE 2ème année, PSI, 2011.
- Valbonne, Lycée International, TIPE : Le bélier hydraulique, Samuel Franch, CPGE 2ème année, PC, 2021.
4.3. About the topic "Ornithology" :
- Vanves, Editions du Chêne, "Phénomènes - De la pollinisation à l'origine des comètes en 124 planches illustrées", Planche n 32 intitulée "Chants des oiseaux", Editions du Chêne 2023, Suzanne Labourie, contributeur en Recherches et Coordination scientifique.
Site UKO.
Tutoriel HTML
Josselin Willette.
Les bases du HTML
Sébastien Laoût.
Balises nécessaires pour faire une page HTML 4.01 Strict
Alexandre Alapetite.
Caractères spéciaux et entités HTML
Web Design Group.
HTML 4 Reference
Alsacreations - Tutoriels et astuces.
Apprendre les standards Web, HTML, CSS, JavaScript, design et développement...
W3C.
HTML 4.01 Specification
WDG HTML Validator ( http://gnu.univ.gda.pl/wdg-html-validator/ ).
Le validateur HTML du WDG (World Design Group) pour site entier
W3C - Markup Validation Service.
Le validateur HTML du W3C (World Wide Web Consortium)
Validateur HTML/XML.
Le validateur HTML Aborla du HTACG (HTML Tidy Advocacy Community Group) associé au W3C (World Wide Web Consortium)
W3C - Link Checker.
Le validateur W3C (World Wide Web Consortium) des liens, ancres et objets référencés en page Web
WDG - CSSCheck.
Le validateur CSS du WDG (Web Design Group)
W3C - CSS Validation Service.
Le validateur CSS du W3C (World Wide Web Consortium)
Régis Petit, former engineer in Computing at EDF (Electricity of France) is a specialist in Systemic modeling. In 2005, he created this scientific information site which is used by numerous schools and organizations, in particular within the framework of projects at the studies end.
Through his research for nearly twenty years and the rigor of the results obtained, the author is one of the world referents of Billiards physics as well as French referents of hydraulic ram.
The various models made by the author are as follows :
- Billards physics : the author wrote in the "Pour la Science" magazine an article fully available on this Website and took part in the broadcasting programmes "Archimède" and C'est pas sorcier - Bille en tête : le billard (Youtube, 25:59). He wrote also the book "Billard - Théorie du jeu" [in English : "Billiards - Theory of the Game"] certified by the Federation of French Billiards.
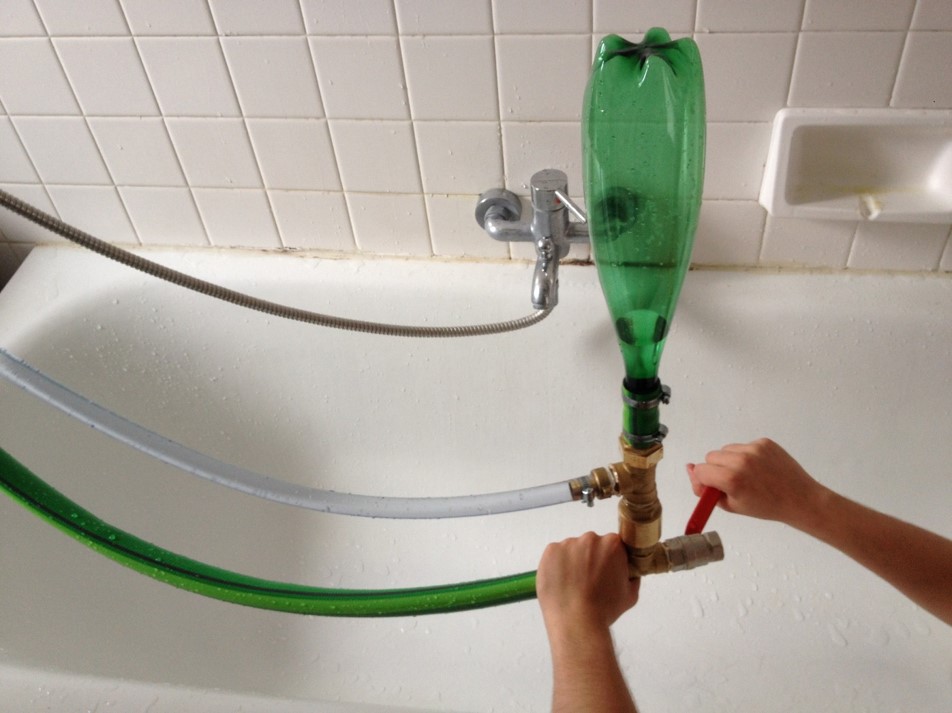
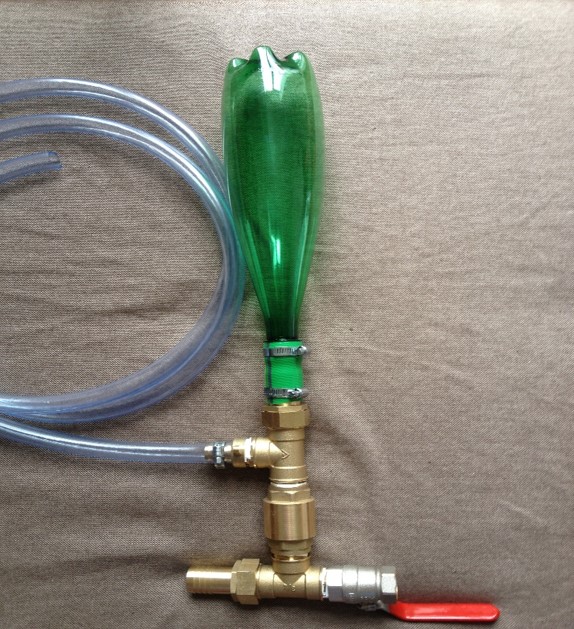
- Hydraulic ram : a thorough study under the three aspects Principle, Theory and Practice. He participates in the activities of the association HSF-Lyon (Hydraulic without Borders - antenna Lyon) for the project "HydroRam" studying the feasibility of an economic hydraulic ram built with commercial components.
- Psychology and spirituality : an anthology called "Une approche scientifique du silence" mainly based on the books of Gurdjieff, Arnaud Desjardins and Svâmi Prajnânpad.
This book is a collection of 700 quotes showing how the rigorous observation of facts on the physical and psychic planes can lead to the forms overcoming and inner silence. The book recalls the laws of life in the introduction.
- Human Nervous System and Learning : a model of baby nervous system in accordance with the learning theory of the psychologist, biologist and epistemologist Jean Piaget.
- Relativity : a pedagogical presentation of the basic formulas of Restricted Relativity and General Relativity. This topic also includes a detailed lexicon of terms used in Relativity.
- Botany : a catalog of 300 European woody plants associated with an identification method mainly by leaves. This topic also includes a detailed lexicon of terms used in botany.
- Music and Language : beyond the well-known aspects of musical sounds (scale, pitch, consonance, timbre, etc.), the author made a pedagogical presentation of some less known aspects of their relationship with human perception (psycho-acoustic) and spoken language. This topic also includes a detailed lexicon of terms used in music, acoustics and spoken language.
- Ornithology : a catalog of 300 European birds associated with an identification method mainly by songs and cries.
- Meteorology and Navigation : the observation of clouds and winds to predict the weather over 24 hours, completed by basic concepts in air and sea navigation. This topic also includes a detailed lexicon of terms used in meteorology and navigation.
- Short synthetic Additional topics. See Site map, pages liens1 to liens6.
- Livre "Billard - Théorie du jeu", Chiron, 1997, 2004 (ISBN 978-2-7027-0999-3).
- Article "La pratique du billard", Pour La Science N 246, Avril 1998.
- Internet topic "Billards physics", 2005 (CopyrightFrance.com).
- Internet topic "Hydraulic ram", 2007 (CopyrightFrance.com).
- Livre "Bélier Hydraulique - Une machine insolite", autoédition, janvier 2008 (ISBN 978-2-9521300-1-1). This book est the first version of the Internet topic "Hydraulic ram".
- Livre "Une approche scientifique du silence", autoédition, janvier 2004 (ISBN 2-9521300-0-0).
- Internet topic "Human Nervous System and Learning", 2009 (CopyrightFrance.com).
- Internet topic "Relativity", 2017 (CopyrightFrance.com).
- Internet topic "Botany", 2019 (CopyrightFrance.com).
- Internet topic "Music and Language", 2020 (CopyrightFrance.com).
- Internet topic "Ornithology", 2020 (CopyrightFrance.com).
- Internet topic "Meteorology and Navigation", 2021 (CopyrightFrance.com).
- Additional topics since 2022 (CopyrightFrance.com).
Régis Petit was born on February 24, 1958.
- Engineer in Mechanics ("Arts et Métiers" - E.N.S.A.M. - Paris)
- Engineer in Applied Mathematics (E.N.S.E.E.I.H.T. - Toulouse)
- P.H.D. in Computing, Artificial Intelligence and Robotics (I.N.P.T. - Toulouse)
- Independent researcher in systemic modeling. France.
See Contact on the site's home page.
Copyright © 2005 Régis Petit.
 Last page update : May 22, 2026.